Observability
Wire a tracker into your ApplicationBuilder with theodosia.tracker(project="...")
and every MCP session writes a JSONL log under ~/.theodosia (the path the
theodosia CLI looks at by default). Three surfaces read that log: the
theodosia:// MCP resources (for the agent), the theodosia CLI (for the terminal),
and the Burr web UI (for replay).
If you use Burr’s own LocalTrackingClient(project="...") directly instead,
sessions write to ~/.burr and you must point the CLI at it with
theodosia sessions ls --home ~/.burr -p <project>. The two helpers exist for the
two audiences (theodosia-first vs Burr-first); pick one per project and stay
consistent.
~/.theodosia is shared per-machine. To isolate a deployment’s store (per
service, per tenant, or to keep CI runs from colliding), set THEODOSIA_HOME in
the server environment, or pass tracker(project=..., storage_dir=...). The CLI
honours the same THEODOSIA_HOME, so sessions / report / verify read the
isolated store without extra flags (or pass --home per call).
Replay a session
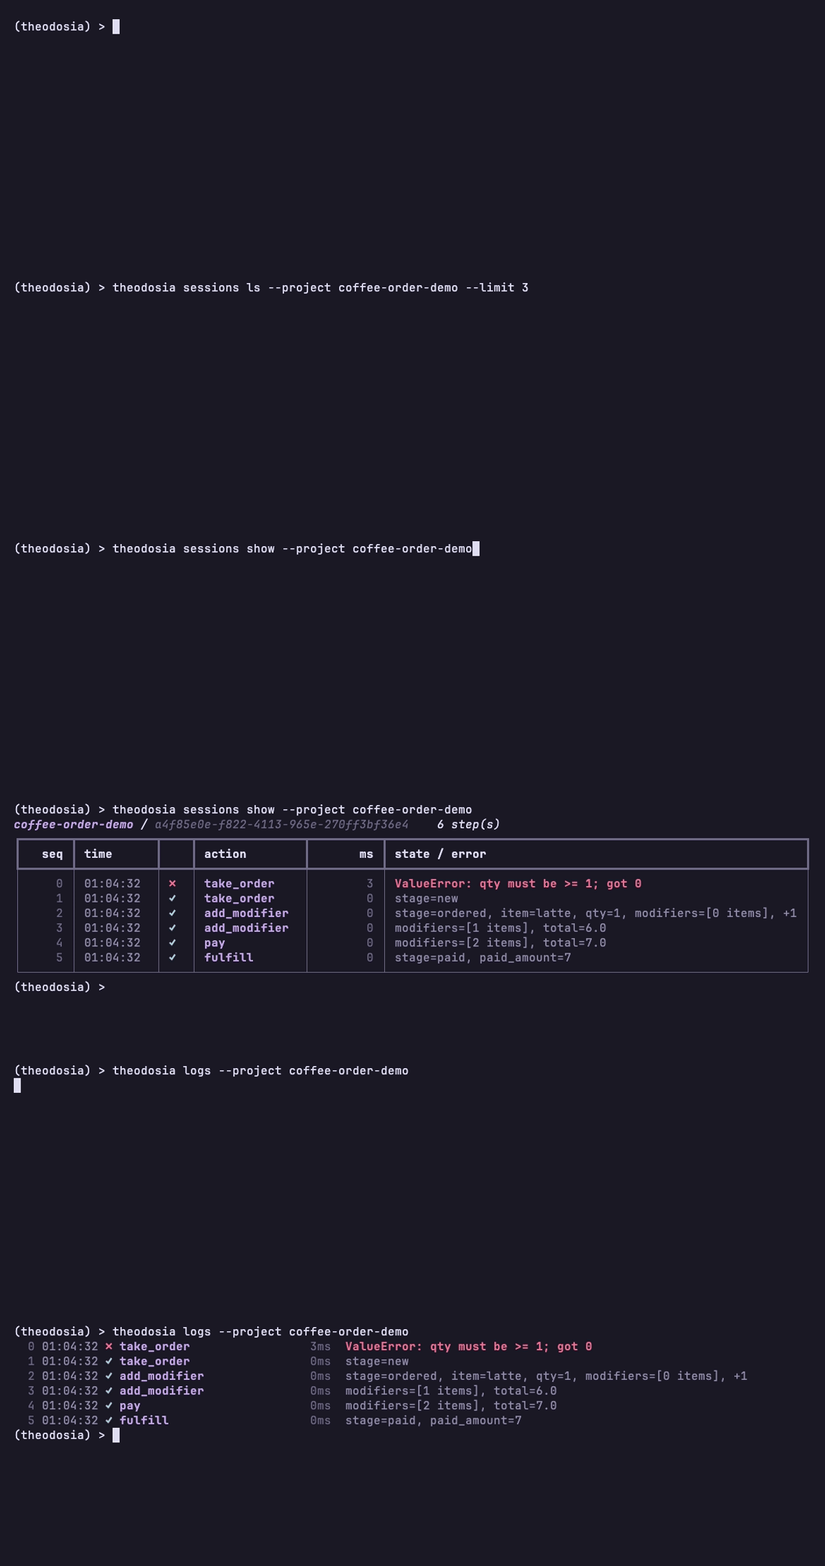
Section titled “Replay a session”theodosia sessions show <id> prints the full timeline for a finished run: each
step’s action, the state diff it produced, refusals, and timing.
seq action state change 0 start_investigation incident set, phase=triage, datasources discovered 1 record_probe findings=[1], backends=[prometheus] 2 record_probe findings=[2], backends=[prometheus, loki] 3 advance_phase phase=verify 4 conclude ⊢ (terminal) primary_service=…, root_cause=…Live-tail a running session with theodosia watch. Open the Burr UI for the
transition graph and state time-travel. Fork from any recorded step with
fork_at(seq) (or fork_from_past across sessions) to branch the run. Refusals
appear in the timeline like any other step.
For the agent: theodosia:// resources
Section titled “For the agent: theodosia:// resources”| URI | Returns |
|---|---|
theodosia://graph | Static FSM topology (actions, transitions, state schema). |
theodosia://graph/mermaid | The FSM as Mermaid stateDiagram-v2 source, conditions on the edges. |
theodosia://graph/dot | The FSM as Graphviz DOT source. |
theodosia://source/{action} | One action’s Python source via Burr Action.get_source(). |
theodosia://state | Current state for this session. |
theodosia://next | Valid next actions from the current state. |
theodosia://history | Per-session attempt timeline, including refusals. |
theodosia://subruns, theodosia://subruns/{id} | Sub-app index and full timeline. |
theodosia://children | Burr-native sub-applications spawned or forked from this session. |
theodosia://upstreams | Configured upstream MCP servers and their health. |
theodosia://trace | Burr’s LocalTrackingClient JSONL mirrored for the agent. |
theodosia://session | Tracker coordinates plus run progress and fork/spawn lineage. |
theodosia://graph/mermaid and theodosia://graph/dot return the same topology
as the render --mermaid / --dot CLI flags, so an agent can read a renderable
diagram of its own state machine. theodosia://source/{action} returns
{action, source}, or {"error": "unknown_action", ...} for a name not in the
graph and {"error": "source_unavailable", ...} when Burr cannot read the
function’s source.
theodosia://session returns the tracker coordinates (project, app_id,
app_dir, partition_key) and adds sequence_id, current_action (the action
auto-routing would run next), and the mounted app’s own fork/spawn lineage as
parent / spawning_parent. Those two are null for a root session; the
descendant direction (sessions this one spawned) is theodosia://children.
theodosia://children reads Burr’s children.jsonl: each entry carries the
child app_id, an event_type (spawn_start for a spawn, fork for a fork),
the parent sequence_id where the link was made, and an event_time. It is
distinct from theodosia://subruns, which indexes Theodosia’s own
spawn_subapp runs; children follows sub-applications created by Burr directly
inside your action code. It resolves only when the child’s tracker shares this
session’s storage_dir and project.
theodosia://upstreams reports configured upstream MCP servers. Shared upstreams
are pinged (opened, tools listed) and returned as
{"mode": "shared", "upstreams": [{server, status, tools|error}]}. Per-session
upstreams report {"mode": "per_session", "servers": [...]} without spawning a
client, and {"mode": "none"} is returned when no upstream is configured. See
Driving other MCP servers.
theodosia://history captures what the agent attempted (including refused steps);
theodosia://trace captures what Burr executed. A refused attempt carries one of
five refusal_reason values (invalid_transition, unknown_action,
action_error, action_timeout, validation_failed) so the agent can tell “the
FSM said no” from “the action’s code raised.”
Synchronous actions are driven through Burr’s app.step rather than app.astep,
because the async path logged the pre-step state for a sync action, lagging
theodosia://trace and fork_from_past by one step. The tracker now records the
correct post-step state.
For the terminal: the CLI
Section titled “For the terminal: the CLI”theodosia status # one-shot snapshot of tracker + projectstheodosia sessions ls # recent sessions, most recent firsttheodosia sessions show <app-id> # full timeline: per-step state diff + timingtheodosia sessions tail [app-id] # live-tail a running sessiontheodosia watch [app-id] # alias for `sessions tail`theodosia logs [app-id] # compact one-line-per-step, greppabletheodosia logs --refusals --plain # only steps that errored, pipe-friendlytheodosia report <app-id> # markdown post-mortem, optional webhooktheodosia verify [app-id] # recompute the ledger hash chainapp-id defaults to the most-recently-touched session and accepts a uuid prefix.
show and watch render a table with a per-step state diff, latency, and a
status glyph (a refused step shows red with its error message). logs --plain
drops color and glyphs for grep. Add --json to ls and show for machine
output.
The CLI reads the on-disk JSONL directly, so it can inspect a session running right now in another process without opening the web UI.
For replay: the Burr UI
Section titled “For replay: the Burr UI”theodosia uiOpens Burr’s web UI, which visualizes every state transition for any tracker
project on disk: state diffing, graph view, replay. Bootstraps via uvx on first
run; permanent install with uv pip install 'theodosia[ui]'.
OpenTelemetry and custom sinks
Section titled “OpenTelemetry and custom sinks”For OTel spans, install theodosia[observability] and use Burr’s
OpenTelemetryBridge as a lifecycle adapter (examples/with_otel.py). Custom
span sinks (Datadog, Honeycomb, in-memory) work through Burr’s PreStartSpanHook
/ PostEndSpanHook / DoLogAttributeHook (examples/custom_telemetry.py).